Study Overview
The paper Improving analytical reasoning and argument understanding: a quasi-experimental field study of argument visualization (Cullen et al. 2018) studies the impact of training in argument visualization on analytical reasoning. The authors hypothesized that training students to visualize the logical structure of presented arguments would lead to improvements on the logical reasoning section of the LSAT. To investigate this hypothesis, they created a 12 week seminar course for freshman students at Princeton consisting of group and individual practice of visualizing arguments. They recruited additional freshman who did not take the seminar to serve as controls, creating a “quasi-experiment” with a structure much like a randomized experiment, but where treatment assignment was not randomized and instead determined by the class enrollment procedure.
Results
The authors conclude that the seminar in argument visualization had a significant positive impact on students’ generalized analytical reasoning skills, as measured by an increase in performance on the logical reasoning section of the LSAT.
Limitations of Original Analysis
A major limitation in the causal interpretation of this outcome is that the study was not a fully randomized experiment. As a result, it is subject to both observed and unobserved potential confounders that could instead explain the results.
Exploratory Analysis
In order to make causal claims, we will want to ensure that the covariate distributions between treatment groups are adequately balanced so that the treated and control units are comparable. Additionally, the treatment schedule itself was rather complicated and so we investigate to ensure we restrict to cohorts that received comparable versions of the treatment.
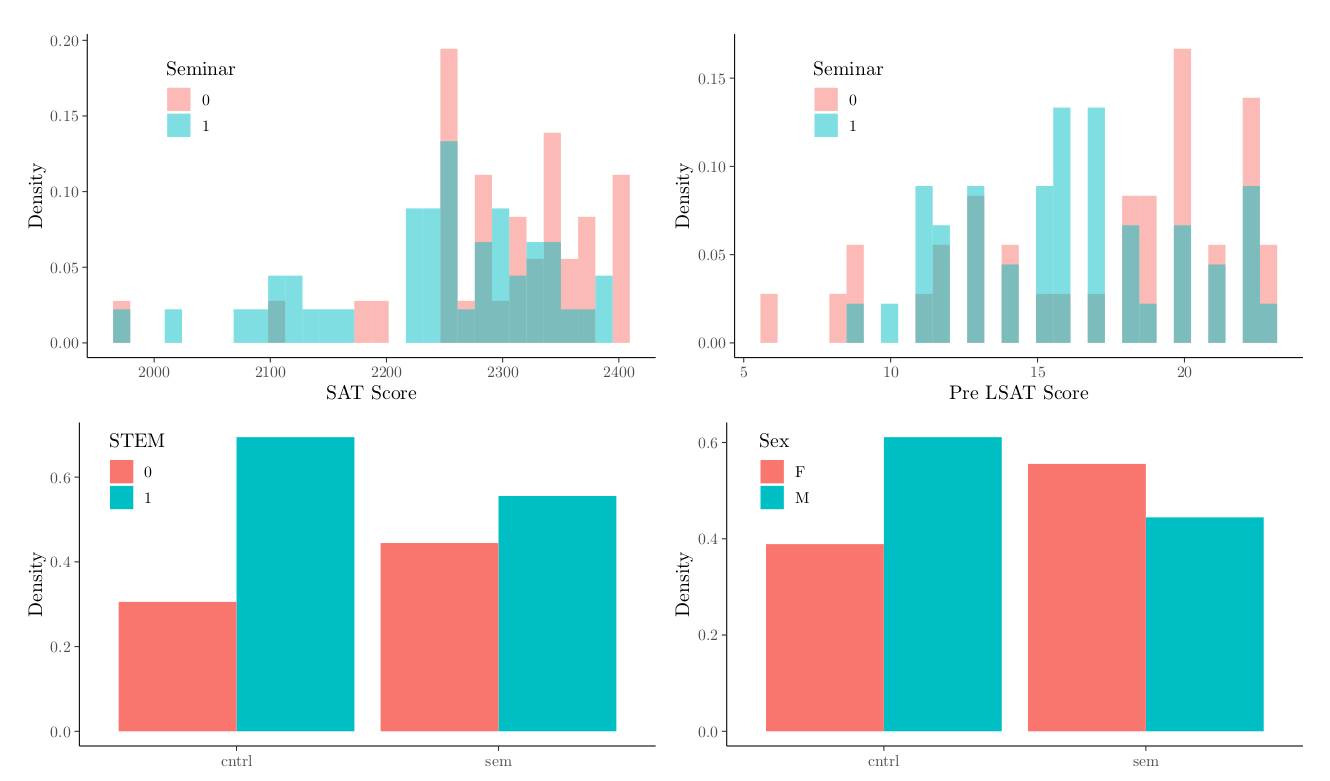
The chart below shows the distributions for the four covariates with the most imbalance between groups.There is a significant difference (p = 0.02) in SAT scores between the treatment group and control group; on average, seminar participants have lower SAT scores. This is an important imbalance, since it’s reasonable to expect a positive correlation between scores on the SAT and LSAT. Visually, there is also some evidence of imbalance in sex and major type, where seminar participants are more likely to be female and in non-stem majors.
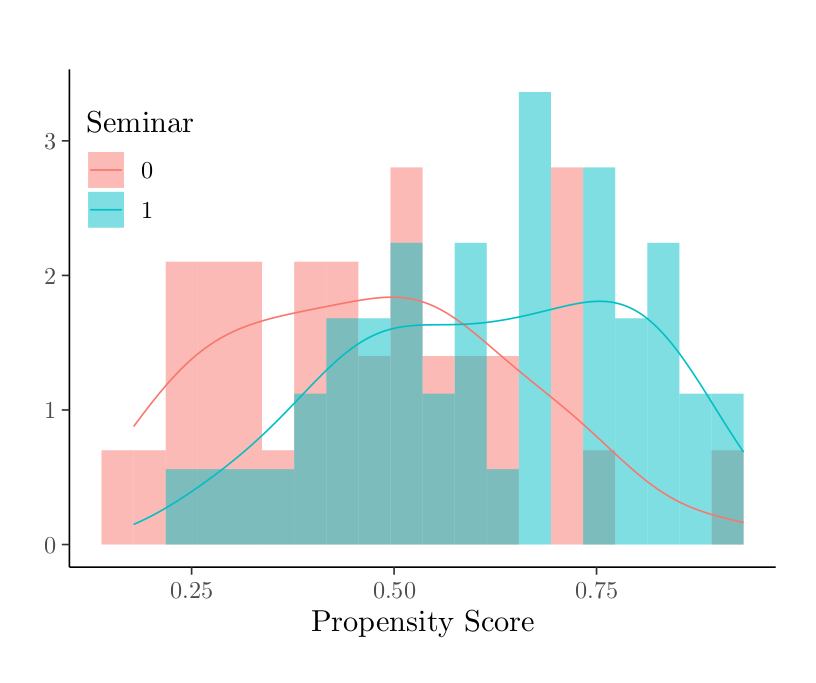
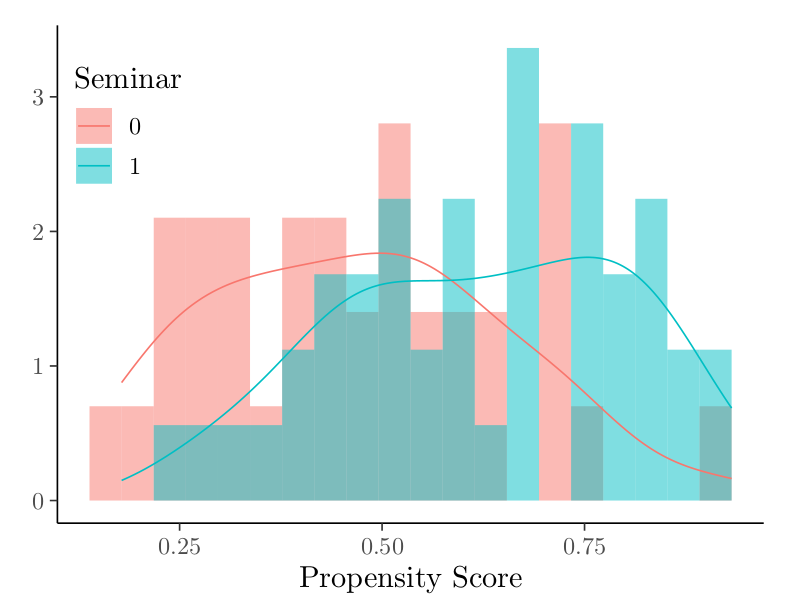
These imbalances can also be captured in a propensity score, calculated using the covariates pre-seminar logical reasoning score, pre-seminar LSAT form (A or B), major type (STEM or non-STEM), sex, ESL, and SAT Score. The histogram of propensity scores below shows that these covariates have predictive power for participation in the seminar.
Causal Inference
There are many methodologies that can be used to account for the imbalance in the observed data. We consider a matching analysis, inverse propensity weighted estimators, and a propensity score subclassification analysis and discuss their relative tradeoffs.
Matching Analysis
In order to reduce imbalance in observed covariates between treated and control units, we use matching to compare only similar treated and control units. In our case, we have more treated than control units and so we sub-select treated units in order to find the closest matches to our smaller pool of controls. We use the Mahalanobis measure as our distance measure for matching and compute distances using the seven covariates shown in Figure 5. This is a reasonable distance metric to use when we have low dimensional data (recommended to have less than 8 covariates) such as in our case here (Rubin 1980). We use optimal matching as our matching algorithm to match pairs (Rubin 1979). Standardized differences in our covariates of interest before and after applying matching are show below.
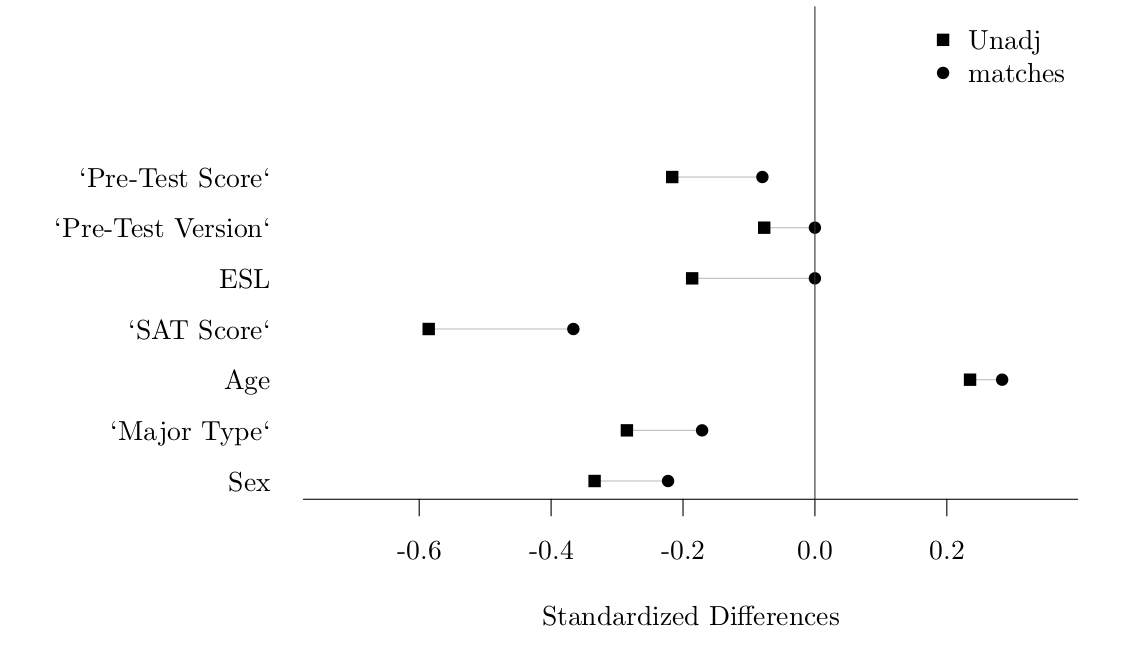
The most concerning is the remaining imbalance in SAT scores. Achieving better matches appears to be a limitation of small sample size. For example, matching solely to balance SAT scores at most reduces the standardized difference to -0.25.
A common way to account for remaining imbalance in the covariates is to do a regression adjustment using the covariates on the matched data (Stuart 2010). This will help adjust for the remaining imbalances that matching wasn’t able to fully smooth out. The regression adjustment shows that the treatment effect result still holds, with an estimated effect of 1.66 points greater improvement in LSAT LR score for students who took the seminar compared to control students (p = 0.007). This effect is close to the original effect of 1.5 in the original study and thus in line with the original findings.
Inverse Propensity Weighted Estimators
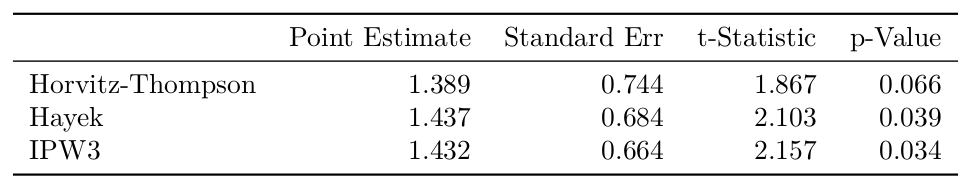
A second way to account for covariate imbalance is to use inverse propensity weighted estimators (Lunceford and Davidian 2004). The results of the IPW estimators are not as strong as the matching results; the second and third estimators are significant at the 5% level, although the Horvitz-Thompson estimator is not. This makes sense given that IPW estimators tend to have high variance, particularly the Horvitz-Thompson estimator; low propensity scores that appear in the denominator are magnified when computing the variance.
Propensity Score Subclassification
Another approach to propensity score estimation of causal treatment effects is stratification by propensity score. Propensity score subclassification has the drawback of being a fairly coarse classification; even within a stratum, there is potential for large variation between units. Theoretically this could be resolved by increasing the number of strata, but we are limited by the fairly small sample size. On the other hand, propensity score subclassification, unlike matching analysis, allows us to use all of our data. This is a non-trivial benefit, given the small sample size.
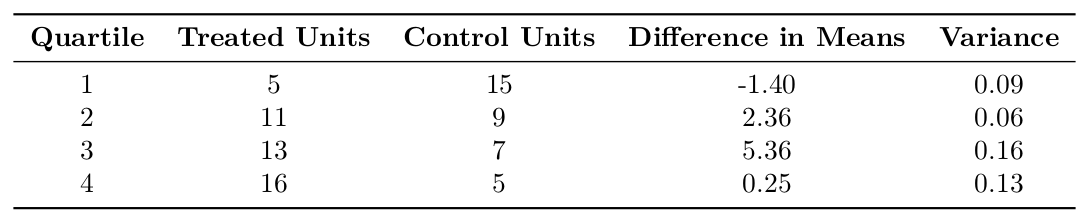
Although Cochran recommends five strata, this results in some strata with as few as two treatment units, which would make the difference in means unreliable (Cochran 1968). Therefore, we use four strata for the propensity score subclassification.
The Neymanian estimator of the stratified difference in means is 1.627, and the estimated variance of the estimator is 0.439. The corresponding 95% confidence interval is [0.3288, 2.9249]. The 95% confidence interval does not contain zero; therefore, Neymanian inference on this stratified design rejects the null hypothesis of no treatment effect for
α = 0.05.
As a non-parametric alternative, we conduct a stratified Fisher Randomization Test. The resulting p-value is 0.017, which confirms the conclusion from the Neymanian analysis.
Sensitivity Analysis
Here we use the senm R function from the sensitivitymult package to conduct an FRT sensitivity analysis on our matched data (Rosenbaum 2007).
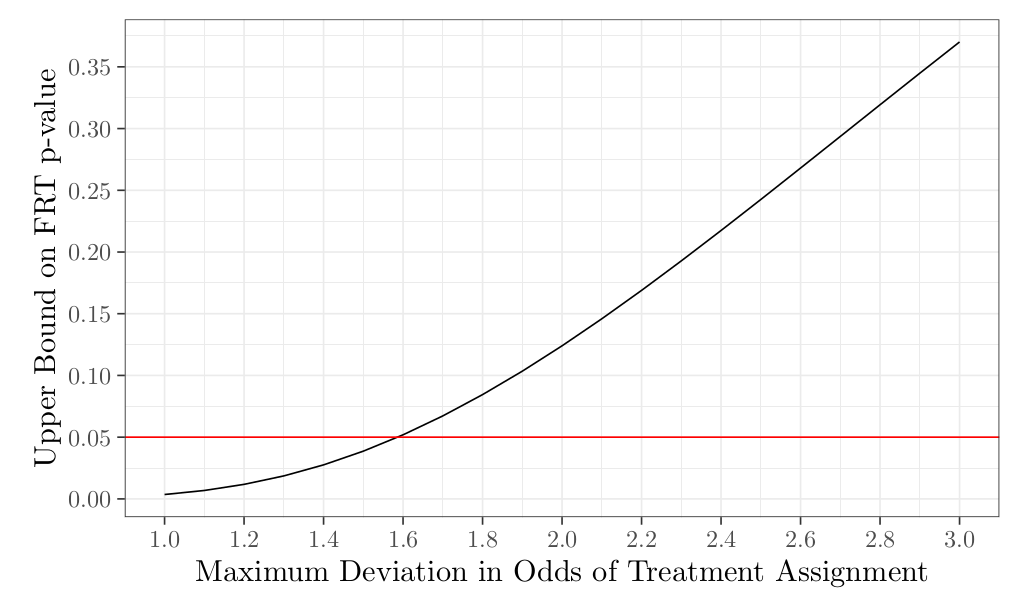
The interpretation is that, at a significance level of 5%, a difference in likelihood of receiving the treatment of 1.6x would result in a change in our qualitative conclusion (i.e. we reject the null). In other words, these results could be explained by some confounding variable that could have caused treated units to be 1.6 times more likely to receive treatment. This is not an exceptionally high threshold and it is conceivable that such a variable with this effect could exist. For example, maybe students who felt that they especially needed help with logical reasoning were more likely to self select in and it would be reasonable to expect that these students have more to gain from training provided by the seminar.
Discussion
In order to validate the causal claim that the visualization training improved students’ LSAT logical reasoning scores, we conducted several analyses to account for the non-experimental nature of the study. All of these analyses showed similar results, which in turn were similar to the original study’s findings. In particular, all of our estimates of the improvement in LSAT scores due to the seminar ranged from 1.38 to 1.66 points, close to the original estimated effect of 1.5 points. An additional contribution of this paper is a sensitivity analysis to determine how sensitive the observed results are to potential unobserved confounders. We found that the results were sensitive to a 1.6x difference in treatment assignment probability within matched pairs.
In order to validate the causal claim that the visualization training improved students’ LSAT logical reasoning scores, we conducted several analyses to account for the non-experimental nature of the study. All of these analyses showed similar results, which in turn were similar to the original study’s findings. In particular, all of our estimates of the improvement in LSAT scores due to the seminar ranged from 1.38 to 1.66 points, close to the original estimated effect of 1.5 points. An additional contribution of this paper is a sensitivity analysis to determine how sensitive the observed results are to potential unobserved confounders. We found that the results were sensitive to a 1.6x difference in treatment assignment probability within matched pairs.
There are several aspects of the current study design that could be adapted to better support causal analysis. Most importantly, a completely randomized design would allow an assessment of the causal effect of the intervention with less worry about unobserved confounders. Absent the possibility of a completely randomized design, we recommend collecting a larger sample to improve matching, and collecting control data in each semester of treatment to account for time effects.
 Download Final Deliverable